
The model GLOBIO 3 is used in our team to estimate the potential loss of species in habitat with reduced naturalness due to human activity by the MSA indicator (Alkemade et al. 2009). The indicator of MSA (mean species area) is built on simple causal-effect relationships between selected driving forces and biodiversity impacts, based on state-of-the-art knowledge. Indicator value MSA 1 corresponds to the maintenance of all native species and value 0 express completely transformed ecosystem without the original species. Five major driving forces, influencing ecosystem naturalness with a direct impact on biodiversity have been selected to assess the landscape status: (i) land use (MSA_LU), (ii) infrastructure development (MSA_I) (iii) fragmentation (MSA_F), (iv) atmospheric nitrogen deposition (MSA_N) and (v) climate change (MSA_CC). The core of GLOBIO 3 is a set of regression equations describing the impact of individual drivers on biodiversity based on the impact-response relationships, derived from the species response tracking database for change. The current version of the database includes data from more than 500 reports.
Model GLOBIO3 has been adapted to CZ-GLOBIO at regional and local level due to higher fragmentation of the Czech landscape and the lack of spatio-temporal databases of plant species occurrence. The CZ-GLOBIO3 model assesses the degree of habitat biodiversity disruption using the method of Habitat Valuation of the Czech Republic (Cudlín et al. 2019).
GLOBIO3 can be used to assess the impacts of environmental drivers on species diversity, for expected trends of biodiversity loss under various future land use change scenarios and also for policy decisions to promote and conserve biodiversity at landscape level ( Alkemade et al. 2009). Our results from the model CZ -GLOBIO can be used for the assessment of ecological damage, regional planning, selection of optimal alternative in the process of Ecological Impact Assessment, effectiveness of subsidy provision and restoration measures in the landscape.
[author]: PBL Netherlands Environmental Assessment Agency
[model´s homepage]: https://globio.info
The Marxan model was designed by Ball et al. (2009) to plan new representative and spatially compact protection sites for landscape planning. The model selects a set of Planning Units (PUs) that include all defined conservation features (CFs), minimising the total cost of the selected PUs. The Marxan model divides the area of interest into PUs that have either hexagonal or square shape (Game and Grantham 2008). The PUs are divided into (i) conserved units, situated in sufficiently protected areas; (ii) available units — can be selected if they include suitable conservation features; (iii) excluded units, excluded from the selection (e.g., built-up areas, arable land). Large-scale, strictly protected areas, or small-scale areas with strict habitat protection, located in larger protected areas with protection zone around them, are considered as sufficiently protected areas.
We conducted our study using the Marxan model across the Czech Republic. The area was divided into hexagonal planning units (PU) with an edge length of 310 m and an area of one hexagon of 25 ha. At the beginning of the analysis, the effectiveness of nature conservation of various types of protected areas in the Czech Republic was critically assessed (Cudlín et al., 2019). ZABAGED and Open Street Map and AOPK CR data were used to define individual categories of PU. All data were in a scale of 1: 10,000 with EPSG 5514 projection. Conservation elements (CF) are considered to be above-average valuable natural and near-natural habitats from the Habitat Mapping Database of Nature Conservation Agency of the Czech Republic (NCA CR), exceeding the minimum area required to maintain them in the landscape. Natural and natural habitats were selected by the Marxan model according to three scenarios in order to protect 25%, 50% and 75% of their total area in the Czech Republic.
We have shown that the Marxan model is applicable to a large area with relatively small size planning units. Therefore it could be used to verify currently protected areas. According to our results, most of the large segments of valuable habitats are already sufficiently protected, with the exception of military areas (Doupovské hory). However, smaller segments of insufficiently protected or completely unprotected valuable habitats are scattered in many areas of the Czech Republic. Sustainable management based on less intensive agriculture and forestry, supporting a naturally close forest composition, should be applied in these areas. The Marxan model proved to be a suitable tool for extensive strategic planning in larger administrative units up to the national scale of the Czech Republic.
[author]: Hugh Possingham & Ian Ball
[model´s homepage]: http://marxan.net
InVEST is a large set of open-source tools (models) designed to map and evaluate ecosystems and natural processes. There is a wide range of tools such as models for carbon modelling, crop pollination modelling, sediment transportmodelling, but also even for fisheries or recreationmodelling. The individual tools are installed in the form of one package, but each is started separately. InVEST is developed within the Natural Capital Project, which is based on a partnership between several of the world’s leading academic institutions—Stanford University, the Chinese Academy of Sciences, the University of Minnesota, The Nature Conservancy and the World Wildlife Fund.
[author]: Natural Capital Project
[model´s homepage]: https://naturalcapitalproject.stanford.edu/software/invest
Outputs from the sediment transport model include the sediment load delivered to the stream at an annual time scale (i.e., “sediment accumulation”), as well as the amount of sediment eroded in the catchment and retained by vegetation and topographic features. The sediment delivery module (used for computation of the sediment accumulation amount) is a spatially explicit model working at the spatial resolution of the input digital elevation model raster. For each pixel, the model first computes the amount of annual soil loss from that pixel, and then computes the sediment delivery ratio (SDR), which is the proportion of soil loss actually reaching the stream. Once sediment reaches the stream, we assume that it ends up at the catchment outlet, thus no in-stream processes are modelled. This approach was proposed by Borselli et al. (2008) and has received increasing interest in recent years (Cavalli a kol., 2013; Lopez-Vicente a kol., 2013 or Sougnez a kol., 2011). The amount of annual soil loss on pixel is given by the revised universal soil loss equation (RUSLE).
As part of our activities, we use this model (or its sub-module) as one of the possible approaches to modeling the soil water retention ability of the landscape, which is related to soil loss and sediment accumulation processes prevailing in the catchment. A comparison of the outcomes of this model with several other selected approaches applied to small experimental catchment was already published here: https://www.mdpi.com/2073-4441/11/3/404
The model uses maps of land use along with stocks in four carbon pools (aboveground biomass, belowground biomass, dead organic matter and soil) to estimate the amount of carbon currently stored in a landscape or the amount of carbon sequestered over time. Aboveground biomass comprises all living plant material above the soil (e.g., bark, trunks, branches, leaves). Belowground biomass encompasses the living root systems of aboveground biomass. Dead organic matter includes litter as well as lying and standing dead wood. Soil organic matter is the organic component of soil, and represents the largest terrestrial carbon pool. Additional data on the market or social value of sequestered carbon and its annual rate of change, and a discount rate can be used to optionally estimate the value of this ecosystem service to society. Limitations of the model include an oversimplified carbon cycle, an assumed linear change in carbon sequestration over time, and potentially inaccurate discounting rates. Biophysical conditions important for carbon sequestration such as photosynthesis rates and the presence of active soil organisms are also not included in the model.
The formulated LOREP model represents an application of the solution using a methodological approach for the identification and localisation of areas with low flood storage capability. This makes it possible to compare the projected scenarios. The structured catalogue of non-technical solutions for the landscape is a part of the model.
The modelling approach is based on a study of Storm Runoff Computing Using Spatially Distributed Terrain Parameters published by the Center for Research in Water Resources at the University of Texas. The main part of the water flowing from the basin is a widespread feature of the hydrograph unit. The study describes in detail how it is possible to refine the final value of the surface runoff. The terrain model is a loaded grid dividing the basins studied in the same parts, and each character is related specifically to the sub-areas mostly square. This division into several smaller parts is the result calculated with the inhomogeneity of the area, which was used in the calculations for the basin as a whole is mostly wiped away. It is a distributed hydrological model with a partial semi-empirical approach
.
The fact that linear features (such as lines of trees) can be a part of land use analysis is the key element of the model. This is possible because the raster data of high resolution (pixel size 5 m) is used and because the modelling is focused on the hydrology of small basins. The procedure for the computation of territorial specific surface runoff is based on a combination of specific functions in GIS, hydrological equations of the runoff curve number method, spatially distributed unit hydrographs. The LOREP model is written in Python and is designed for ArcGIS. The input data is expressed as a grid of pixels in agreement with the rules of raster representation in ArcGIS. The spatial resolution of the pixels is selected so that it is high enough to identify the influence of linear features on the landscape on the extent of surface runoff
The model for the calculation of the runoff over each pixel has been created according to the above equations, the selected function unit hydrograph. Specifically, the tool can be connected freely through ArcToolbox, which was written in ArcGIS as a script in Python syntax. The input data are vectors characterizing the area (elevation, water flows, land use) and a layer containing the special characteristics of the basin (the layer with the values of the CN curves and hydrological categories group soils). Other inputs represent the numerical value of the average flow rate, the total catchment area, the rainfall and the time at which the drain is to be found.
[author]: own software (developer V. Pechanec)
[model´s homepage]: ----
StraKa is a tool for landscape structure analysis. Tool offers a set of tools for calculating advanced landscape structure algorithms published by Forman and Godron (1993). The tool contains both Czech and English interface. The tool is created in the form of a toolbox for ArcGIS 9.2. All tools contain comments and general help for the tool and for each tool parameter. Comments are supplemented by the formula of the index, describing their purpose, and illustrative pictures.
This software as one of the approaches for assessing land use. Specifically for calculating indices of landscape metrics.
[author]: own model (developers: V. Pechanec & K. Pavková)
[model´s homepage]: ---
Patch Analyst enables spatial landscape analysis, supports habitat modelling, biodiversity conservation and forest management. This is an extension for ArcGIS, which is available in two variants. One is Patch Analyst, which works with vector data, the other is Patch Grid for raster layers.
The Patch Analyst was developed with the support of the Ontario Ministry of Natural Resources and is freely available on the website of the Canadian University of Lakehead (Rempel, Carr and Kaukinen, 2008). This extension is based on FRAGSTATS. Patch Analyst menu consists of 12 functions, which are divided into four thematic groups. The output of the extension is a table of calculated index values in the DBF.
This software we use for calculating indices of landscape metrics and for spatio-temporal analysis.
[author]: Dr. Robert Rempel - Centre for Northern Forest Ecosystem Research Ontario & Ministry of Natural Resources
[model´s homepage]: http://flash.lakeheadu.ca/~rrempel/ecology
Model EFISCEN (the European Forest Information Scenario model) is a large-scale forest model that projects forest resource development on regional to European scale. The model uses National Forest Inventory data (NFI – e.g. NFI1 and NFI2 in the Czech Republic) and Forest Management Plans data (FMP – e.g. in the Czech Republic) as a main source of input to describe the current structure and composition of forest resources. The model can project the development of forest resources, based on different scenarios, mainly determined by management actions and changes in forest area and growth rates. The model includes multiple indicators related to important forest ecosystem services (production of wood, carbon sequestration, biodiversity etc.).
To initialise the model, EFISCEN needs the area, average growing stock volume and net annual increment per each species and per age class of each forest type. EFISCEN projects stem wood volume, increment, age-class distribution, removals, forest area, natural mortality and deadwood for every five-year time-step. With the help of biomass expansion factors, stem wood volume is converted into whole-tree biomass and subsequently to whole tree carbon stocks. Information on litterfall rates, felling residues and natural mortality is used as input into the soil module YASSO (e.g. Liski et al. 2005), which is dynamically linked to EFISCEN and delivers information on forest soil carbon stocks.

Model is designed for large forest areas (e.g. provinces or countries). Application to smaller areas is possible, but there have been no studies yet to determine the minimum size and effects of scale on uncertainty of the projections.
[author]:Alterra & EFI
[model´s homepage]: https://www.efi.int/knowledge/models/efiscen
Based on the information mentioned above, one part of model EFISCEN is a soil module based on the YASSO soil model. The model YASSO can simulate carbon dynamics in the soil. The Yasso07-UI works with input information that is accessible in practice. This information consists of: 1) the initial state of the soil in terms of the amount of ash free organic carbon in the soil and its chemical quality in terms of AWEN fractions; 2) the climatic conditions as monthly or annual precipitation and mean monthly or annual temperature; and 3) the estimated ash free organic carbon input into the soil in non-woody and woody litter, including the estimated size distribution of the woody litter - again in terms of the AWEN chemical fractions.
[author modelu]:Jari Liski
[model´s homepage]: https://en.ilmatieteenlaitos.fi/yasso
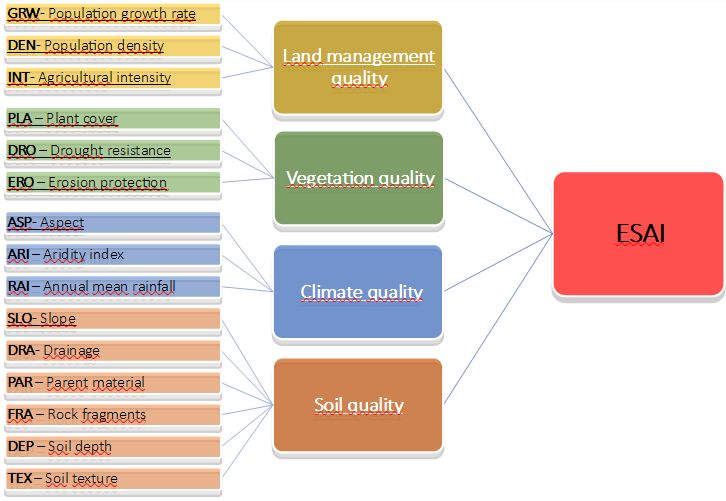
Environmental Sensitivity Assessment Index (ESAI)- is a methodology assessing the area sensitivity to degradation in terms of loss of the ability to perform ecosystem functions and services. It combines environmental and socio-economic indicators to identify potential risks well in advance. The methodology was developed in Mediterranean area within the Medallus project focused on desertification risk. The main concept was proposed by Kosmas et al. (1999), minor modifications were then made Basso et al. 2000, Salvati a Bajocco 2011); recently the method is widely used in Mediterranean countries.
The principal is based on assessment of variables whose combination increases the probability of land degradation. These variables are sorted into four thematic groups, expressed in map layers in GIS and evaluated by index value ranging from 1 to 2:
• Climate quality (annual mean rainfall rate, aridity index, aspect)
• Vegetation quality (fire risk, erosion protection, drought resistence, plant cover)
• Soil quality (soil texture, soil depth, parent material, rock fragments, drainage, slope)
• Human pressure/quality of management (population density, population growth rate, agriculture intensity)
From these variables, the final ESAI index is calculated using two steps of geometric mean (for thematic groups and for final result).
Our version differs from the original methodology mainly by adjustment of the scale of some variables to our environmental conditions and by significant refinement of map layers using detailed combined layer (NATURA 2000+Zabaged) instead of Corine LC. All listed indicators except fire risk were used. Using this methodology in the Czech Republic, it is possible to identify the areas potentially at risk of ecosystem functions and services loss. Although the present risk of desertification in the Czech Republic is not so significant, in the future conditions of climate change we can expect the increase of degradation. The ESAI can help us to identify the areas at highest risk so that adaptation and mitigation measures can be taken there in advance.
[author]:Kosmas et al.
[model´s homepage]: ---
The Habitat Valuation Metod was formed by Seják et al. (2003) and is an expert method establishing a list of all national habitats and rank them according to their capacity as specific environments for living plant and animal species, using points according to eight ecological characteristics (matureness, naturalness, structural diversity, diversity of species, rareness of habitat, rareness of species, habitat vulnerability, habitat endangerment). Natural and close to nature habitats were taken from Habitat mapping in Natura 2000 framework (Nature Conservation Agency of the Czech Republic, 2004), while 53 new unnatural and anthropogenic habitats were defined for the purpose of this method. The HVM method was in 2018 modified and newly determine 38 unnatural and anthropogenic habitats (natural and close to nature habitats stay unchanged, Seják et al. 2018).
The HVM is one of the possibilities of how to evaluate the habitat provision ecosystem service) for species provision ecosystem services. The financial value of this ES was calculated via the method of average national costs of restoration measures, necessary for maintaining and improving the biodiversity of habitats. It expresses the average costs of a 1 point value increase in 1m2 within 136 valuated actions in the frame of supportive programs of the Czech Ministry of Environment. These reached a value of 0,44 € in 2003 Seják et al. (2003). The value was recalculated in 2017 by using information from 182 revitalization projects realized from the fund of Operational Programme Environment in 2007-2017; the value increased to 1,14 € (Seják et al. 2018; Machar et al. 2018).
[author]: Josef Seják et al.
[model´s homepage]: ---
The CLUE model is a flexible, generic land use modeling framework which allows scale and context specific specification for regional applications. The original idea of the first CLUE model version was made by Tom Veldkamp and Louise Fresco and published in 1996. Later versions were created by Peter Verburg in collaboration with colleagues at Wageningen University and worldwide.
The CLUMondo model is a spatially explicit and dynamics land system change model. CLUMondo is based on the land systems approach. Land systems are socio-ecological systems that reflect land use in a spatial unit in terms of land cover composition, spatial configuration, and the management activities employed. The precise definition of land systems depends on the scale of analysis, the purpose of modelling, and the case study region. In contrast to land cover classifications the role of land use intensity and livestock systems are explicitly addressed. Each land system can be characterized in terms of the fractional land covers. An example for a Local scale land systems classification for Laos is provided below. land systems are characterized based on the amount of forest in the landscape mosaic and the management type ranging from swidden cultivation to permanent cultivation and plantations.
The CLU(Mondo) is distributed as freeware and can be downloaded together with a tutorial through the links at the bottom of this website It is not possible to provide support on the application unless in the context of collaborative projects.
[author]: Peter Verburg et al.
[model´s homepage]: https://www.environmentalgeography.nl/site/data-models/models/
Deterministic model for prediction of landuse area development. It uses Markov chains to predict the landscape's land area change under the Bussiness as Usually scenario. Calculates the probability of change between years, but does not know the spatial location. It currently uses Corine Land Cover (1990-2018) data to determine the BaU scenario. Implementation in R.
[author]: own software (developers: Jitka Doležalová & Vilém Pechanec)
[model´s homepage]: ---